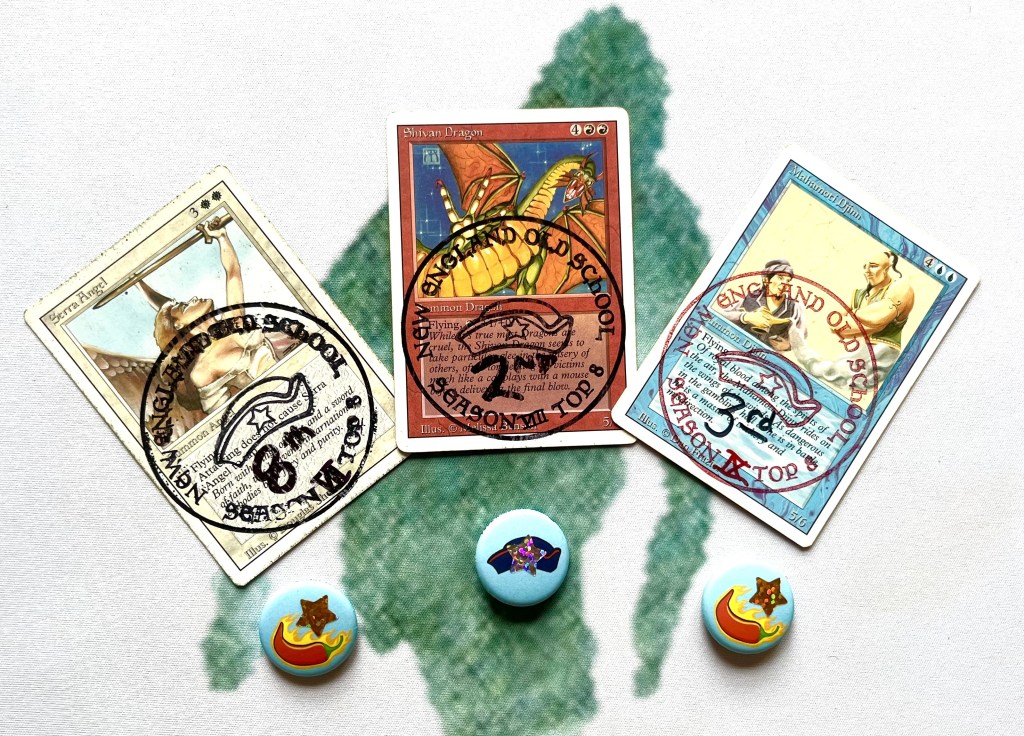
Old School Magic is many things: a love letter to 1993, a reason to dust off your dual lands, and — depending on who you ask — a competitive format embedded inside a casual one. The New England Old School (NEOS) community has been running serious organized events for years, generating match data every season.
As a kid, I never got to compete with the best decks at the highest level. I didn’t have the collection, and I didn’t have the skills. Years later, one of the things I enjoy about this hobby is the ability to look more critically at a game I played as a kid, and getting to apply analytical tools I’ve learned over the decades. I get to peer into this game at a much deeper level than I ever had a chance when I was young, and I find that very satisfying. To me, knowing the ins and outs of the format doesn’t make it less fun, it makes it way more fun.
In juxtaposition (a word I learned from this game), I sincerely respect the origins of Old School and the desire of those who created the format to avoid netdecking and overanalysis of a casual format. I fully agree that the easy availability of information on the internet is part of what took the charm out of early Magic. Wak-wak was very good early on about showing diverse decks, but not necessarily the strongest versions. However, change is inevitable. I think the format and the state of old school has inexorably shifted to be much more well-known and documented. As always with old things and nostalgia, there is no truly going back.
That said, I’ve always wanted to understand this game better, so with the luxury of time, I’ve been able to look deeply at this format and game we all love. This project was a way for me to look into and understand the exact matchups with as much precision I could muster. I also wanted a chance to take the latest AI tools out for a spin for some data analysis. Of course I picked a passion project. They work incredibly well. They aren’t perfect – image scans of deck pics are still not useful, but there’s plenty that can be automated with AI.
So with that context out of the way, let’s get into it.
The Dataset: 10 Seasons of NEOS
The analysis covers Seasons 6 through 15 (Fall 2021 – Spring 2026) — ten seasons of NEOS competition spanning my five years of organized play.
By the Numbers
- 10 seasons (Season 6 through Season 15), 50 monthly events
- 328 unique players have played in at least one NEOS event and 123 unique players have reached a KO bracket across any season
- 6,291 Swiss matches recorded across all seasons and 435 KO bracket matches across 50 events with bracket data
- 33 deck archetypes tracked — from The Deck and LDB to Twiddlevault, Robots, and color-combo builds; 473 decks scanned and classified across 49 events (1 monthly is missing deck pics)
- Average attendance per monthly event: ~47 players; largest single event was Season 10 September 2023 with 75 players
How the League Works
Each NEOS season runs five months — February through June in the spring, August through December in the fall, skipping January and July (reserved for the Winter and Summer Derbies). Players are drawn into groups at random and play a Swiss round-robin within their group. All group matches are best of 3, with a deadline around the 17th of each month. Each player commits to a single deck for the full month — no changing builds between rounds. The group winner advances to the knockout stage; players with five or more match wins also qualify regardless of whether they won their group. KO rounds are also best of 3.
Original Old School — all Swedish, Atlantic, variants, Boreal
NEOS rotates formats every month. Across Seasons 6–15, that meant 7 pure Atlantic events, 8 Atlantic variants (4x Wasteland, Reduced CC Legends, Mirage Fetchlands, Doubleton, A2A, 1 Set of Duals, and more), 7 Swedish (six pure plus one Swedish variant with Factory restricted), 3 Boreal, and 25 further events spread across X Point, 7 Point, Original 6, and an assortment of one-offs. The archetype analysis in this section is restricted to the 25 events (50%) in the first family — Atlantic, its variants, Swedish and its variant, and Boreal, grouped here as “Original Old School.” They share the same lineage (the original 93/94 restricted list with regional tuning on top — extra Wastelands, a freed-up Strip Mine, a restricted dual land here or there), they’re what’s played in the Winter and Summer Derbies, and they’re the biggest slice with matched archetype data to draw conclusions. Both the deck-prevalence chart and the Elo table below cover only these 25 events.
Most Played Archetypes (by deck pics)
All deck pics are from KO bracket rounds — only players who qualified for the knockout stage have deck photos. This means these are the most played archetypes among players who were already performing well, not just popular choices across the full field. Restricted to the 25 Original Old School events, that’s 235 categorized decks. Some deck pics are just missing, but the data that is there is illustrative and shows what people already expect.
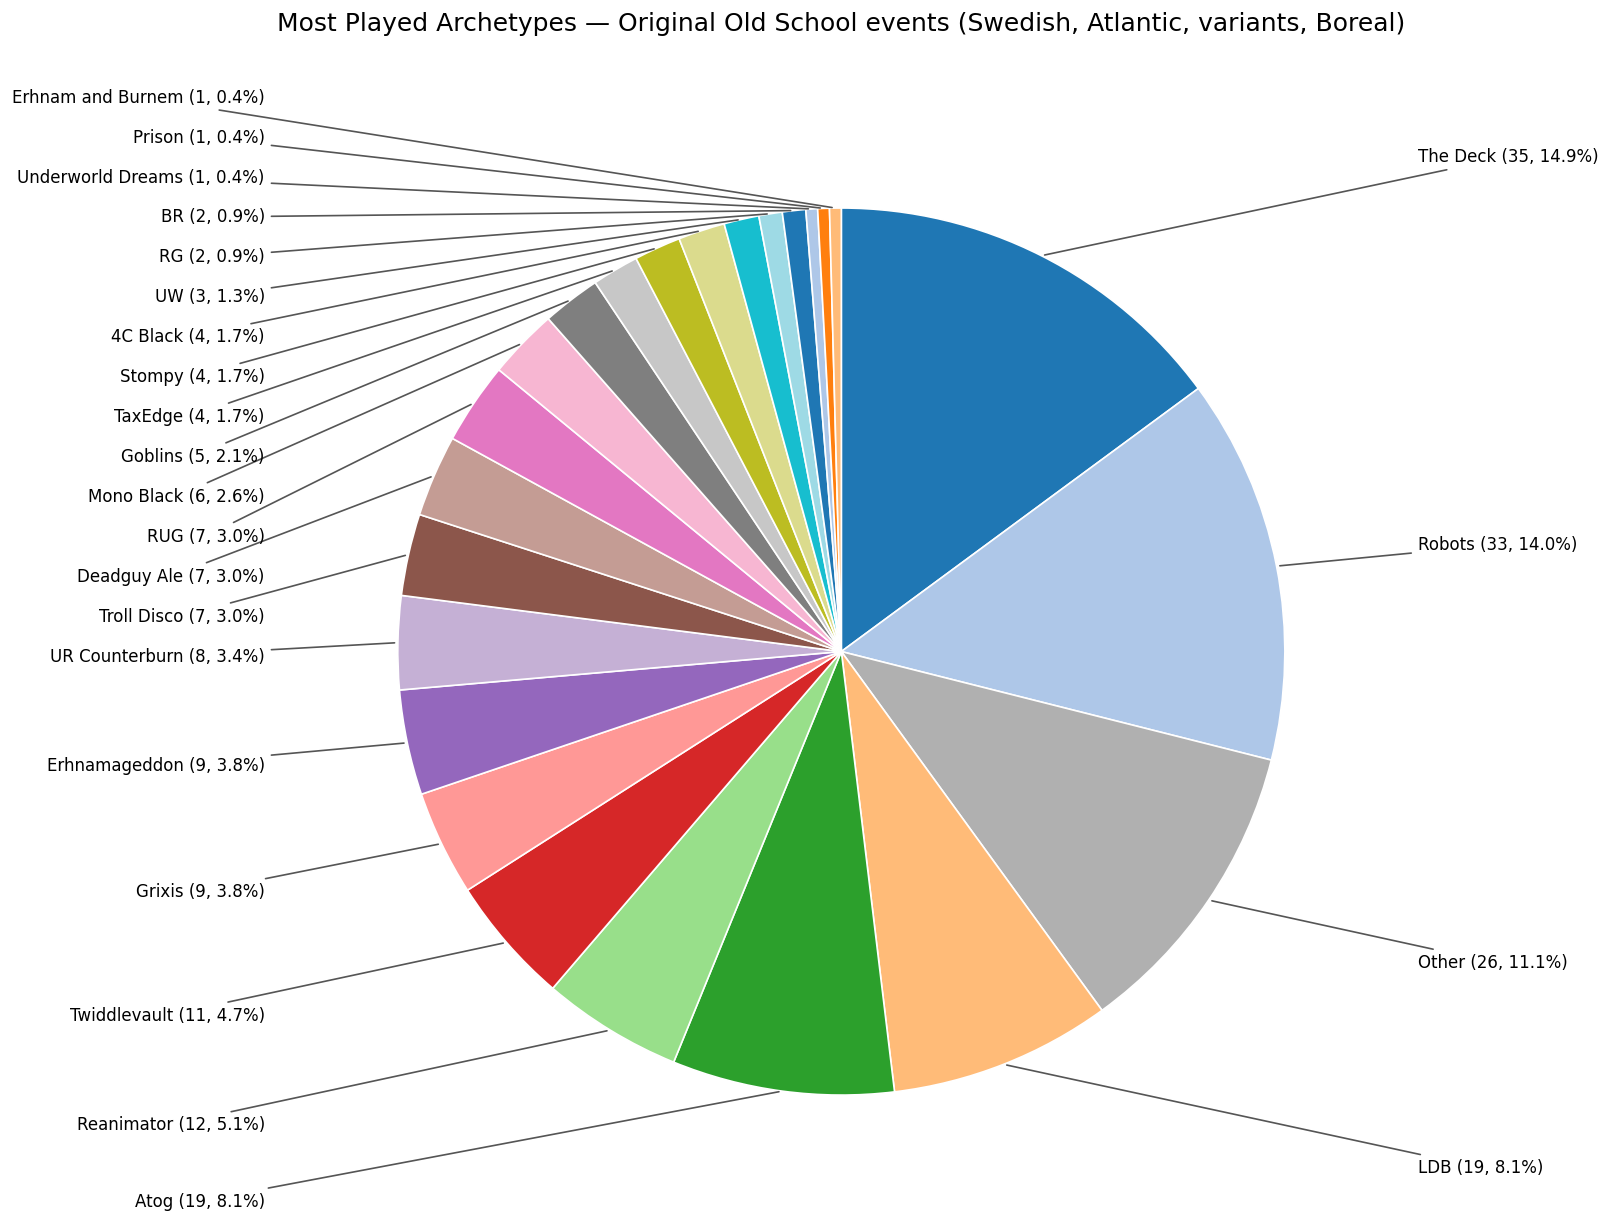
The Deck and Robots sit at the top, together accounting for more than a quarter of all bracket decks in these formats. “Other” is a real archetype label here — rogue brews that don’t fit any of the ~30 tracked archetypes — and its 11.1% share says something nice about this community: even among players who made the bracket, roughly one deck in nine is something homebrewed.
Deck Archetype Ranking
The table is ranked by win rate, but read it alongside the KO Appearances / Unique Players columns — they change the story. RUG’s 75.0% tops the list, but it’s a tiny sample (7 appearances, 6 players) riding mostly on its Boreal performance. UW is another thin one (3 appearances) — it’s like SSS, with Counterspells, Disenchants, Lions, and Dibs, plus other good stuff. I didn’t know what else to call it. Reanimator is the same story at a smaller scale — a strong win rate (54.5%) with 14 of the 17 KO appearances from Mark Evaldi. The decks that actually lead on volume are Robots and The Deck, with 32 and 33 KO appearances each from 19 and 20 different pilots — the broadest base of any archetype here — and they post the strongest win rates of any high-volume deck (60.6% and 58.5%). These are all small sample sizes.
The W/L columns count every knockout match where that archetype’s deck was pic’d and identified, win or loss. The Elo column is different: it can only move on head-to-head games where both decks were identified, so it (and the 198-match figure below) rests on a slightly smaller set than the raw records.
Elo is a rating system borrowed from chess: win against strong opponents and your rating rises; lose to weaker ones and it falls — giving a single number that reflects both record and strength of schedule. The table tracks head-to-head archetype matchups — only matches where both players had a deck pic. Pooling the four formats gives the largest matched-archetype sample in the dataset: 198 archetype-vs-archetype matched matches across the 25 events. Sample sizes are small even pooled together, so treat this as a directional signal rather than a settled verdict. I did more analysis based solely on Elo, but in the end, it showed basically the same decks doing well and Win% is more commonly used and easy to understand. For example, TwiddleVault ranks right near the top in Elo for pure-Atlantic events off just a handful of matches, but that feels overly narrow to be useful.
Combined ratings — Swedish (+ variant) + Atlantic (pure + variants) + Boreal, Knockout rounds only:
| Rank | Archetype | W | L | Win% | Elo | KO Appearances | Unique Players |
|---|---|---|---|---|---|---|---|
| 1 | RUG | 12 | 4 | 75.0% | 1617.8 | 7 | 6 |
| 2 | Robots | 40 | 26 | 60.6% | 1579.4 | 32 | 19 |
| 3 | The Deck | 38 | 27 | 58.5% | 1605.3 | 33 | 20 |
| 4 | UW | 4 | 3 | 57.1% | 1516.6 | 3 | 3 |
| 5 | Reanimator | 12 | 10 | 54.5% | 1536.7 | 12 | 3 |
| 6 | LDB | 20 | 17 | 54.1% | 1513.4 | 19 | 12 |
| 7 | Troll Disco | 7 | 6 | 53.8% | 1511.5 | 7 | 5 |
| 8 | Twiddlevault | 11 | 10 | 52.4% | 1511.6 | 11 | 4 |
| 9 | Atog | 18 | 17 | 51.4% | 1537.7 | 18 | 12 |
| 10 | TaxEdge | 3 | 3 | 50.0% | 1505.6 | 4 | 4 |
| 11 | Deadguy Ale | 7 | 7 | 50.0% | 1500.2 | 7 | 3 |
| 12 | Erhnam and Burnem | 1 | 1 | 50.0% | 1499.3 | 1 | 1 |
| 13 | Grixis | 7 | 9 | 43.8% | 1489.5 | 9 | 9 |
| 14 | 4C Black | 3 | 4 | 42.9% | 1488.5 | 4 | 4 |
| 15 | UR Counterburn | 5 | 7 | 41.7% | 1473.6 | 7 | 3 |
| 16 | BR | 1 | 2 | 33.3% | 1489.5 | 2 | 2 |
| 17 | Erhnamageddon | 4 | 8 | 33.3% | 1485.8 | 8 | 7 |
| 18 | Underworld Dreams | 0 | 1 | 0.0% | 1487.2 | 1 | 1 |
| 19 | Prison | 0 | 1 | 0.0% | 1484.8 | 1 | 1 |
| 20 | RG | 0 | 2 | 0.0% | 1470.6 | 2 | 2 |
Sorted by win rate, RUG (#1, 6 players) tops the table on a tiny, Boreal-heavy sample. But right behind it the decks with real breadth take over: Robots (#2) and The Deck (#3), 19 and 20 unique pilots — a genuine “these decks are good” result rather than a specialist skew. The small-sample specialists (UW at #4 on 3 players, Reanimator on 3) sit just below them. Pooling all four formats together smooths out some real differences between them — Robots, for instance, swings from a middling 60% in pure Atlantic to 65%+ once variants are folded in, and dips back to 50% in Boreal.
All-Time Results: Who’s Winning at NEOS?
The Shape of the Field
Across all ten seasons and 328 players, the win rate distribution tells a story about who shows up to NEOS and why. This chart uses Swiss match results only — KO bracket matches are excluded because they skew win rates lower (only players who qualified for the bracket play KO rounds, and they’re playing against each other).
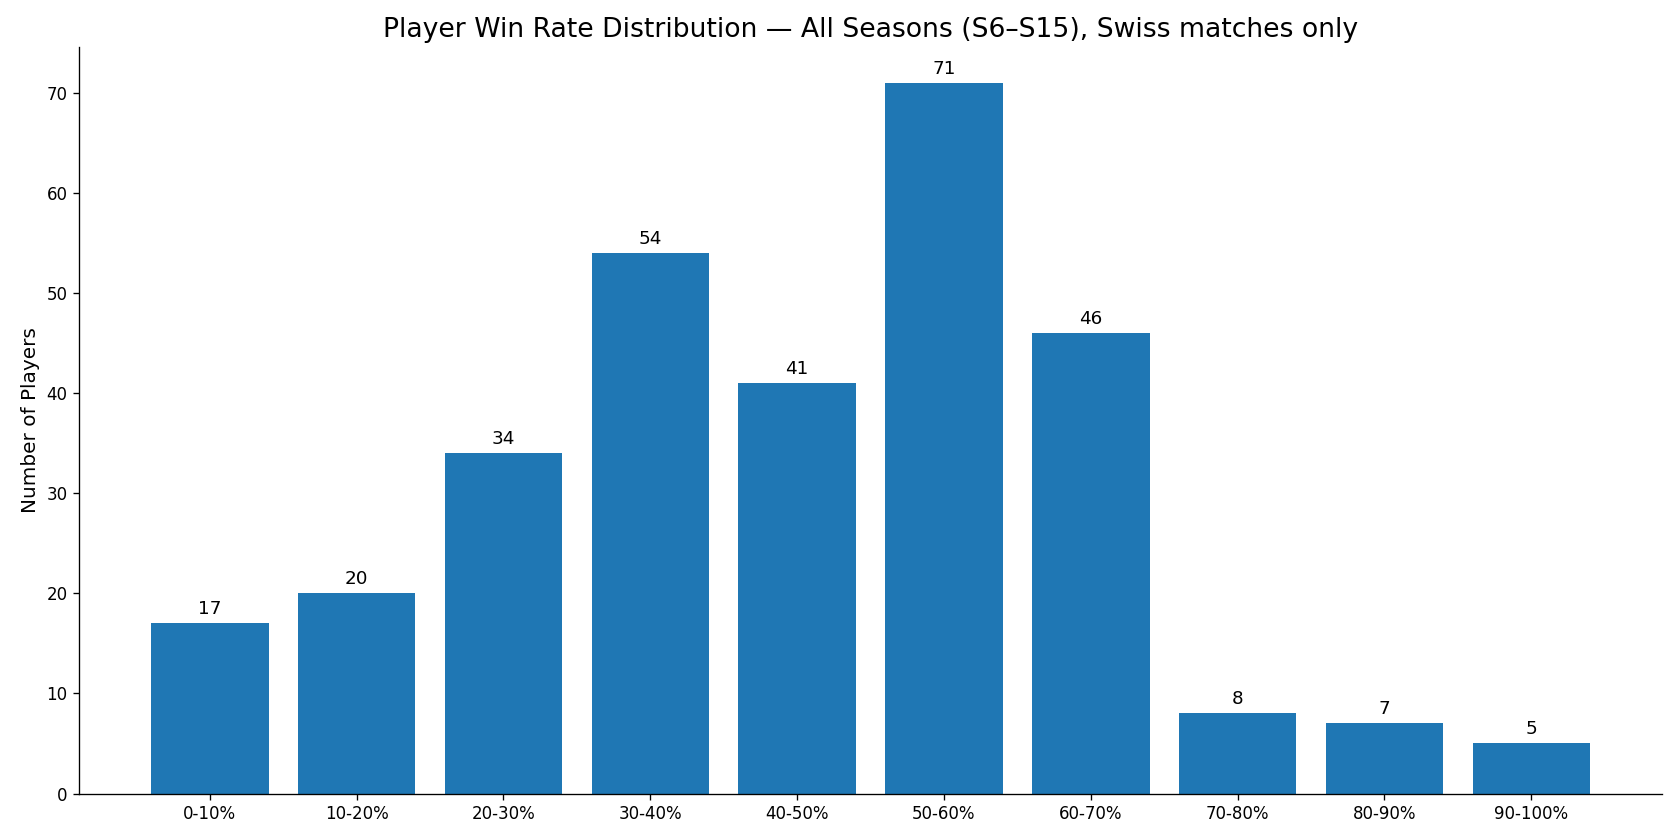
The 90–100% bucket (5 players) is entirely one-time attendees who went a perfect 6-0 in their only event. The 80–90% bucket (7 players) is mostly the same story — six of the seven are one-event 5-1 attendees — but it also holds one real outlier: Lucas Glavin, who has sustained an 80.8% Swiss win rate across 276 matches and 47 events. He’s the only player in either bucket with more than one event to his name — more on him in a moment.
The distribution peaks at 50–60% — the competitive core, players who are genuinely trying to go 5-1 and make the knockout bracket. But about a quarter of the field wins fewer than 30% of their matches. That likely isn’t a failure of skill development; it reflects two different reasons people play. Some are here to compete hard and push for the bracket. Others are here to play interesting decks in a format they love, and the result column is secondary. Both audiences coexist in the same event every month, which is part of what makes NEOS work as a community. The rest of this section lives entirely in the right tail of that distribution.
Lucas Glavin is Winning the Most — and It Isn’t Close
Across 47 events and 276 Swiss matches, Lucas Glavin has won 223 of them — an 80.8% Swiss win rate sustained over ten seasons. That is not a hot streak. That is a level of consistent dominance that stands alone in a dataset of 328 players.
To put it in context: the next closest players with comparable match volumes are Rich Shay at 73.2% (190 matches) and Rob Hackney at 67.5% (200 matches). Glavin’s win rate is more than 7 percentage points above the next closest volume player. He has also won many of the monthly tournaments outright, and won 7 of the 10 seasons by having the most points at the end of the season.
The All-Time Leaderboard
Players ranked by Swiss win rate (wins ÷ wins+losses, knockout matches excluded), minimum 20 wins. Swiss is the regular season — every player’s group-stage games — so this rewards sustained, month-in, month-out performance; the knockout rounds get their own table below. The 20-win floor also filters out anyone who posted a high percentage over a short, lucky run. The Elo column is context, not the ranking: Elo reflects who you played, not just how often you won. It’s computed from every Swiss and KO match across Seasons 6–15 in chronological order (K=32, starting at 1500) — and since Swiss is ~94% of all matches, it’s a mostly-Swiss rating despite including the brackets.
At first I didn’t include Player Elo ratings. I didn’t think that’s the spirit of the format. And it doesn’t say who’s the best player, it says who wins the most with few losses. And many players (including me) switch it up and spike sometimes and spice othertimes. This data doesn’t tell that story. But I had the data all ready, so I of course had to ask the questions. I’m sure others would want to see it too.
Top 20 players by Swiss win rate (minimum 20 wins):
| Rank | Player | W | L | Win% | Elo | Events |
|---|---|---|---|---|---|---|
| 1 | Lucas Glavin | 223 | 53 | 80.8% | 1689.2 | 47 |
| 2 | Ty Thomason | 58 | 18 | 76.3% | 1816.7 | 13 |
| 3 | Rich Shay | 139 | 51 | 73.2% | 1683.6 | 32 |
| 4 | Michael Scheffenacker | 118 | 52 | 69.4% | 1624.6 | 29 |
| 5 | Will Parshall | 75 | 34 | 68.8% | 1721.9 | 18 |
| 6 | Jeff White | 22 | 10 | 68.8% | 1663.9 | 6 |
| 7 | Rob Hackney | 135 | 65 | 67.5% | 1756.2 | 34 |
| 8 | Noah Shanning | 83 | 41 | 66.9% | 1625.8 | 21 |
| 9 | Brandon Equils | 32 | 16 | 66.7% | 1695.8 | 8 |
| 10 | Mark Evaldi | 126 | 63 | 66.7% | 1630.6 | 34 |
| 11 | Ben Tash | 70 | 35 | 66.7% | 1601.4 | 19 |
| 12 | John Grudzina | 23 | 12 | 65.7% | 1587.8 | 6 |
| 13 | Simon Christie | 30 | 16 | 65.2% | 1621.6 | 8 |
| 14 | Maxime Godbout L’Hebreux | 22 | 12 | 64.7% | 1584.7 | 6 |
| 15 | Jared Doucette | 116 | 66 | 63.7% | 1576.0 | 30 |
| 16 | Peatr Simpson | 115 | 67 | 63.2% | 1494.2 | 33 |
| 17 | Jeff Grasso | 180 | 109 | 62.3% | 1509.0 | 48 |
| 18 | Matthew Messa | 137 | 83 | 62.3% | 1692.4 | 38 |
| 19 | Mike Frantz | 44 | 27 | 62.0% | 1593.3 | 12 |
| 20 | Parker Bowab | 27 | 17 | 61.4% | 1587.2 | 8 |
The most battle-tested players in the top tier besides Lucas are Rich Shay and Rob Hackney, with 32 and 34 events respectively — and Will Parshall, who shows up consistently across 18.
The Elo column tells its own story alongside the win rates. Ty Thomason holds the highest Elo in the dataset (1817) despite sitting second by win rate — his 13 events came against consistently strong competition. Glavin’s Elo (1689) trails several players below him on this list for the opposite reason: 47 events at every skill level dilutes a rating that rewards strength of schedule. One player who isn’t on this list at all makes the point best: Rich Arevalo’s Swiss win rate sits right at 50% (115–115), nowhere near the top 20 — but his Elo (1611) is well above average, because he consistently gets matched tough opponents and wins.
One limitation worth stating: Elo doesn’t decay. A player who dominated five seasons ago and then stopped playing retains that rating. These numbers are a snapshot of cumulative historical performance, not current form.
Winning the Knockout Rounds
The table above is the regular season. The knockout rounds are a different, higher-pressure test — single elimination, best players only — and by raw KO win rate the very top is a wall of perfect records:
- Corey Farach and Bryan Manolakos each won two events outright with zero knockout losses — flawless 100% marks (6-0 and 5-0).
- Nick Fox, Tim Kincaid, Peter Soltesz, and Viktor Osterberg each ran the table in their one knockout appearance — undefeated, also 100%.
- Brandon Equils and Jason Seaman each went 5-1 — winning a knockout bracket and losing late in another — for 83.3%.
Those are all short, spectacular runs, though, and past them Lucas Glavin leads again: 73-20 (78.5%) across 36 knockout appearances, far more bracket games than anyone else. Choosing a cutoff to separate a hot streak from sustained dominance was genuinely hard — there are many defensible ways to measure “who’s best” in the playoffs — but trimming the list to players with 3 or more knockout appearances felt like the fairest way to reward consistency without erasing the perfect small-sample runs above.
Top 20 by knockout win rate (minimum 3 KO appearances):
| Rank | Player | Win% | Elo | W | L | KO Appearances |
|---|---|---|---|---|---|---|
| 1 | Lucas Glavin | 78.5% | 1689.2 | 73 | 20 | 36 |
| 2 | Ty Thomason | 66.7% | 1816.7 | 12 | 6 | 8 |
| 3 | Michael Simpson | 61.9% | 1563.2 | 13 | 8 | 9 |
| 4 | Rich Shay | 61.0% | 1683.6 | 25 | 16 | 19 |
| 5 | Thomas Sutherland Borja | 60.0% | 1540.2 | 3 | 2 | 3 |
| 6 | Pj Melies | 60.0% | 1370.6 | 3 | 2 | 3 |
| 7 | Rob Hackney | 58.6% | 1756.2 | 17 | 12 | 13 |
| 8 | Phillip Collier | 57.1% | 1636.3 | 4 | 3 | 3 |
| 9 | Jdubs | 56.0% | 1540.7 | 14 | 11 | 13 |
| 10 | Mark Evaldi | 53.3% | 1630.6 | 16 | 14 | 16 |
| 11 | Rich Arevalo | 53.3% | 1611.0 | 8 | 7 | 8 |
| 12 | Noah Shanning | 52.4% | 1625.8 | 11 | 10 | 11 |
| 13 | Jared Doucette | 52.4% | 1576.0 | 11 | 10 | 11 |
| 14 | Jeff Grasso | 51.6% | 1509.0 | 16 | 15 | 17 |
| 15 | Brannon Ozark | 50.0% | 1518.9 | 4 | 4 | 4 |
| 16 | James Tilley | 50.0% | 1651.9 | 3 | 3 | 3 |
| 17 | Cristian Sanchez | 50.0% | 1603.9 | 3 | 3 | 3 |
| 18 | Jonathan Hamel | 50.0% | 1574.5 | 3 | 3 | 3 |
| 19 | James Nace | 50.0% | 1594.9 | 2 | 2 | 3 |
| 20 | Matthew Messa | 47.8% | 1692.4 | 11 | 12 | 13 |
Glavin’s 78.5% over 36 appearances is untouchable on volume; behind him a small tier — Ty Thomason, Michael Simpson, Rich Shay — sustains 60%+ across many brackets, while most of the rest of the field settles near the 50% coin-flip that single-elimination tends to produce.
Player Spotlight: Jdubs
Since I asked AI to write much of this, I of course asked it to write about Jdubs. I liked what it concluded, so I left it in below:
Jdubs has been one of the most consistent presences in NEOS competition, playing in 38 events across ten seasons — one of the highest participation counts in the dataset. His career splits two ways: a 59.5% Swiss win rate (131-89 — 25th, just off our regular-season list) and a 56.0% knockout win rate (14-11 — 9th in the bracket). But those numbers obscure a career arc that is far more interesting than a single percentage.
Season-by-Season
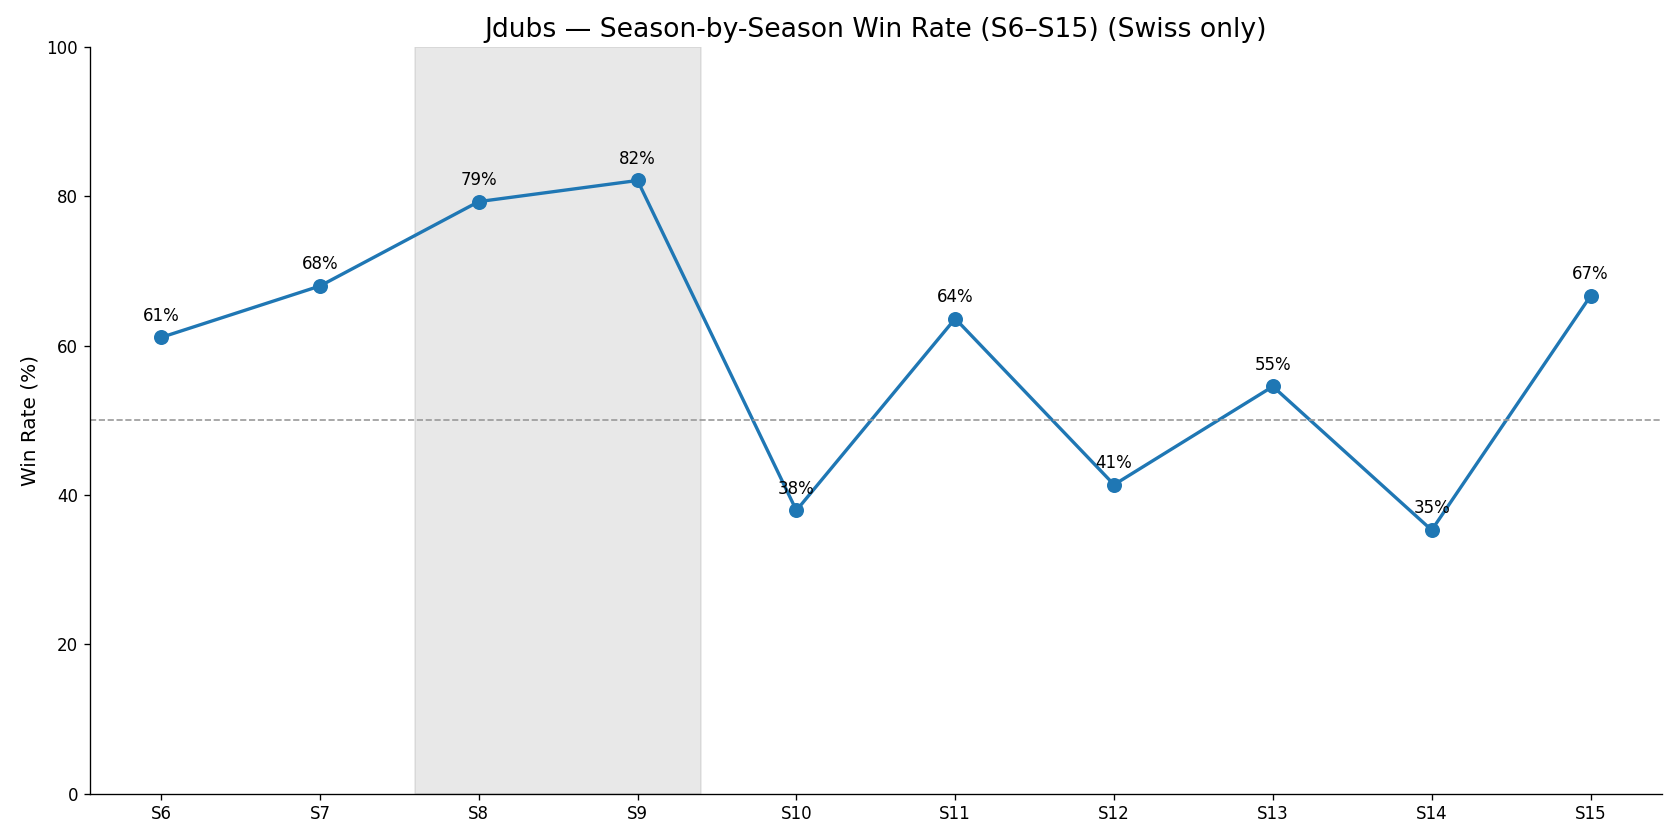
Seasons 8 and 9 were remarkable. Back-to-back seasons at 79.3% and 82.1% — putting him in Lucas Glavin territory for those two years. In Season 9 he went 6-0 in May and 5-1 in June back to back. He wrote about going 6-0 with Glasses of Urza that May. In Season 8 he went 6-0 in December. Over those two seasons combined, he went 46-11 across 10 months of play. That is top-tier performance by any measure.
His peak Elo rating of 1781.6 was reached in Season 9 June, the last month of his peak season. It’s the 5th highest peak in the dataset across all 328 players. For context, Lucas Glavin’s all-time peak was 1940.4 (Season 12 December), and several other high-volume competitors — Ty Thomason (1817.8), Rich Shay (1795.1), Jeff Grasso (1782.7) — sit in the same neighborhood just above him. Jdubs’s peak puts him firmly in the top tier historically, just not at the very top. This is an even more narrow way to look at the data, that says Jdubs had a strong streak for a time then reverted. I left it.
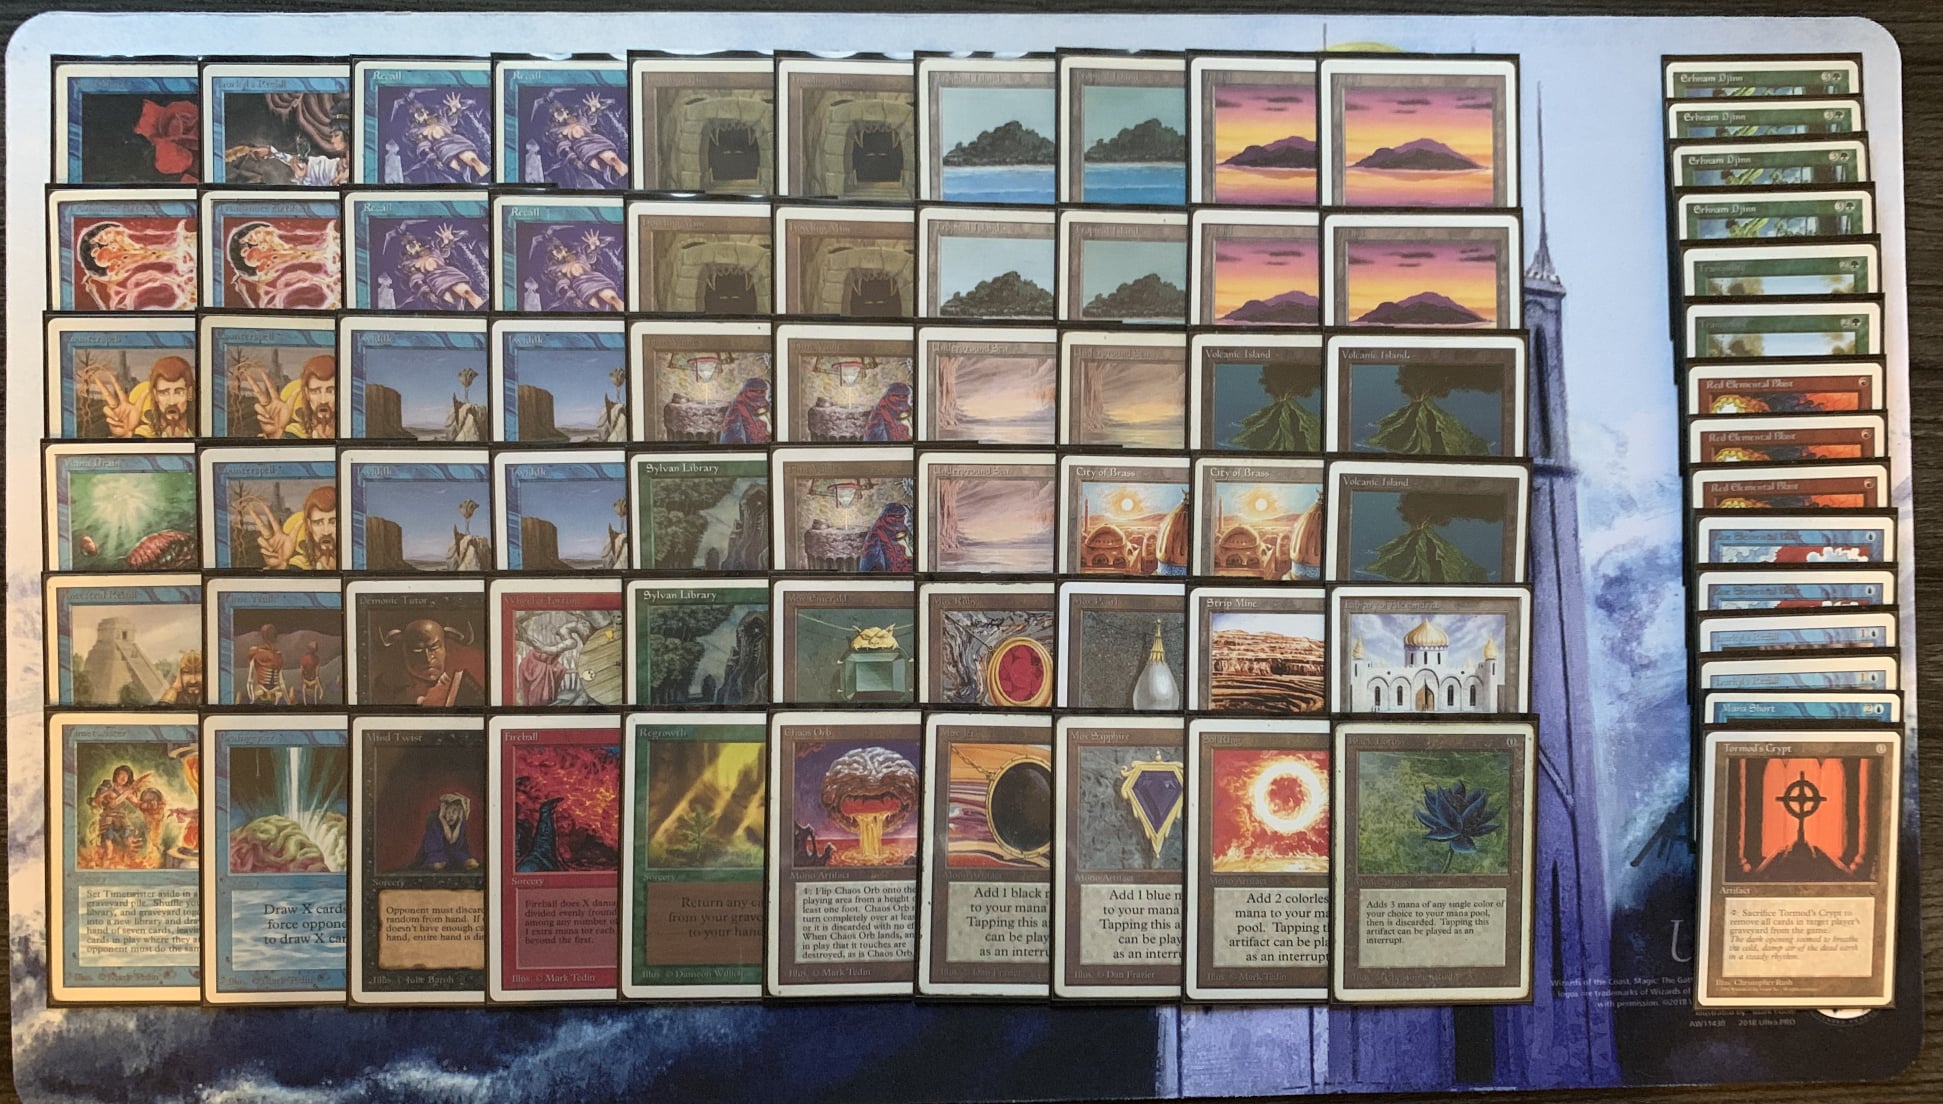
This was my typical Twiddlevault deck — I won the monthly near the end of Season 7 with this.
Season 10 was a cliff. After two dominant seasons near 80%, Jdubs fell to 37.9% — less than half his Season 9 rate. He went 1-5 in both August and October, and never found his footing across five months. Whether that reflects a meta shift, a deck change, real-life availability, or just variance, the data doesn’t say — but the drop is as sharp as the peak was high.
The two Golden Ghost Pepper wins for spice came in Season 10 August and Season 10 September — the same season where the win rate chart shows the sharpest drop of his career. The numbers say cliff; the Ghost Peppers say he was having a great time anyway.
Seasons 11 through 14 show a player finding a new equilibrium. He’s no longer the 80% threat of his peak, but he’s winning more than he’s losing in most months, staying present, and continuing to compete at a format he’s clearly invested in across half a decade of organized play.
For a format that rewards deep experience and familiarity with the card pool, Jdubs’s arc is exactly the kind of story this dataset was built to tell (and why I built it).
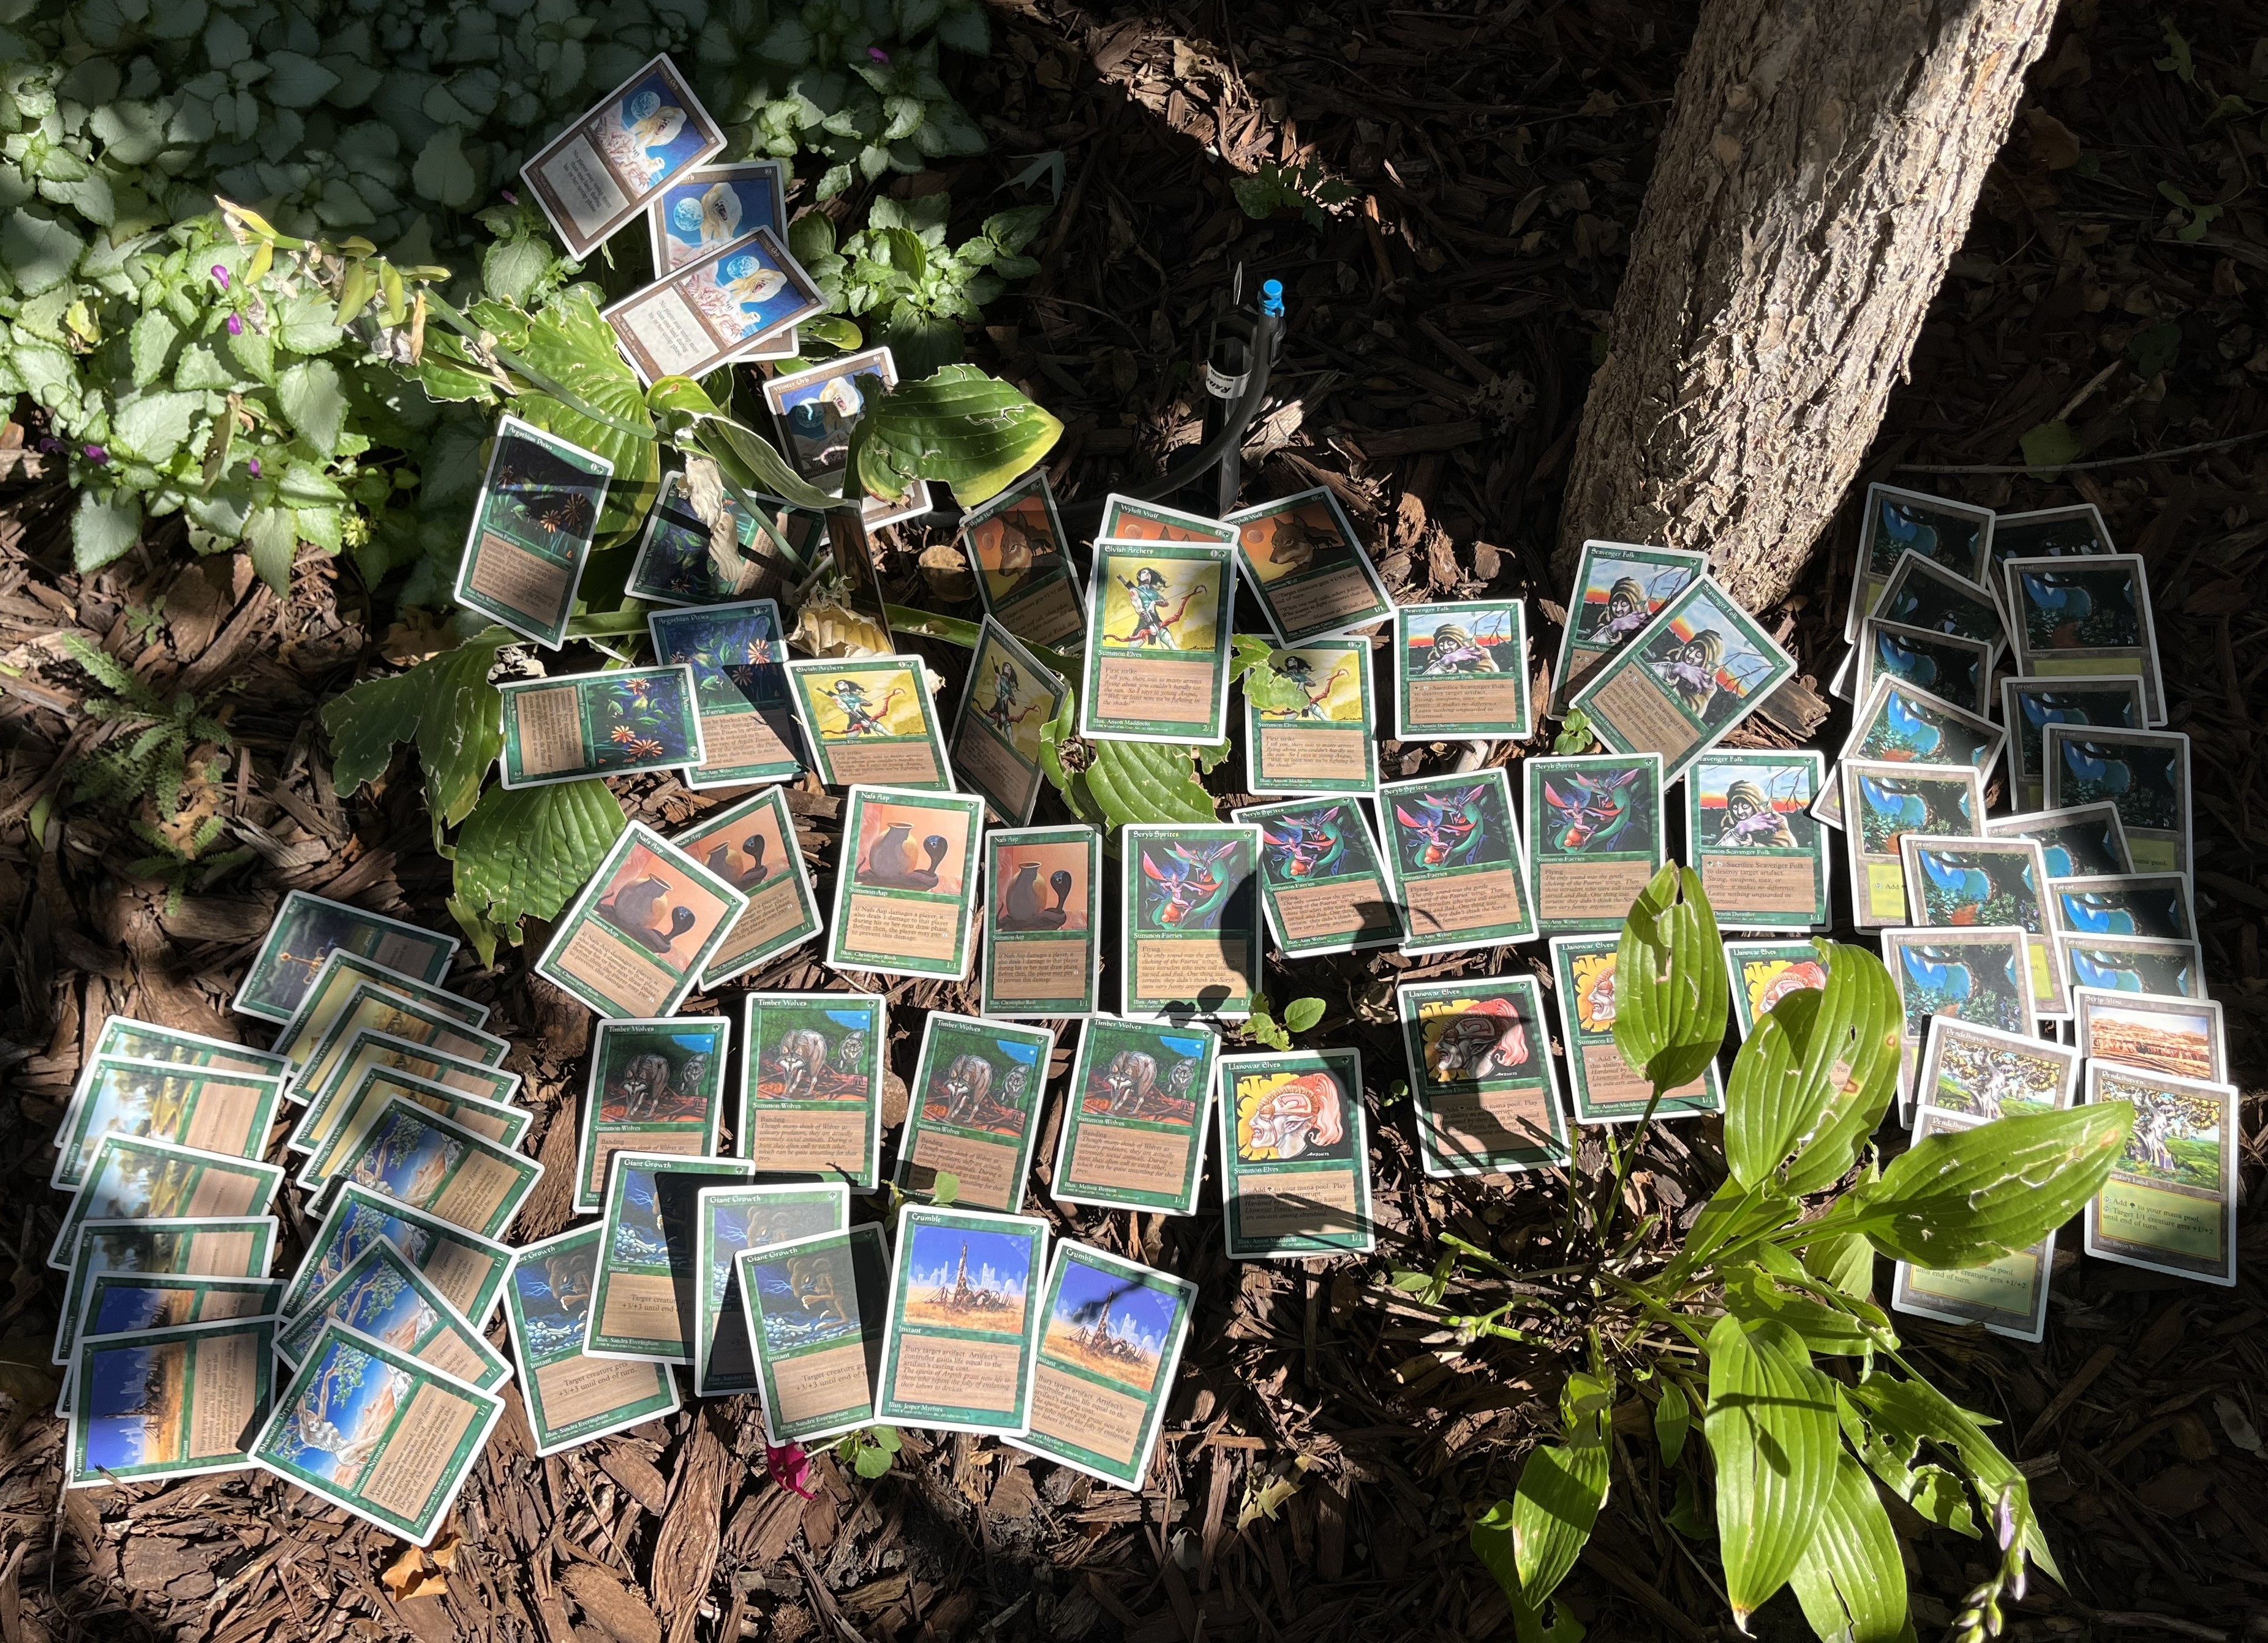
Golden Ghost Pepper Award — Season 10 August. Deck: Wild Woodland Creatures
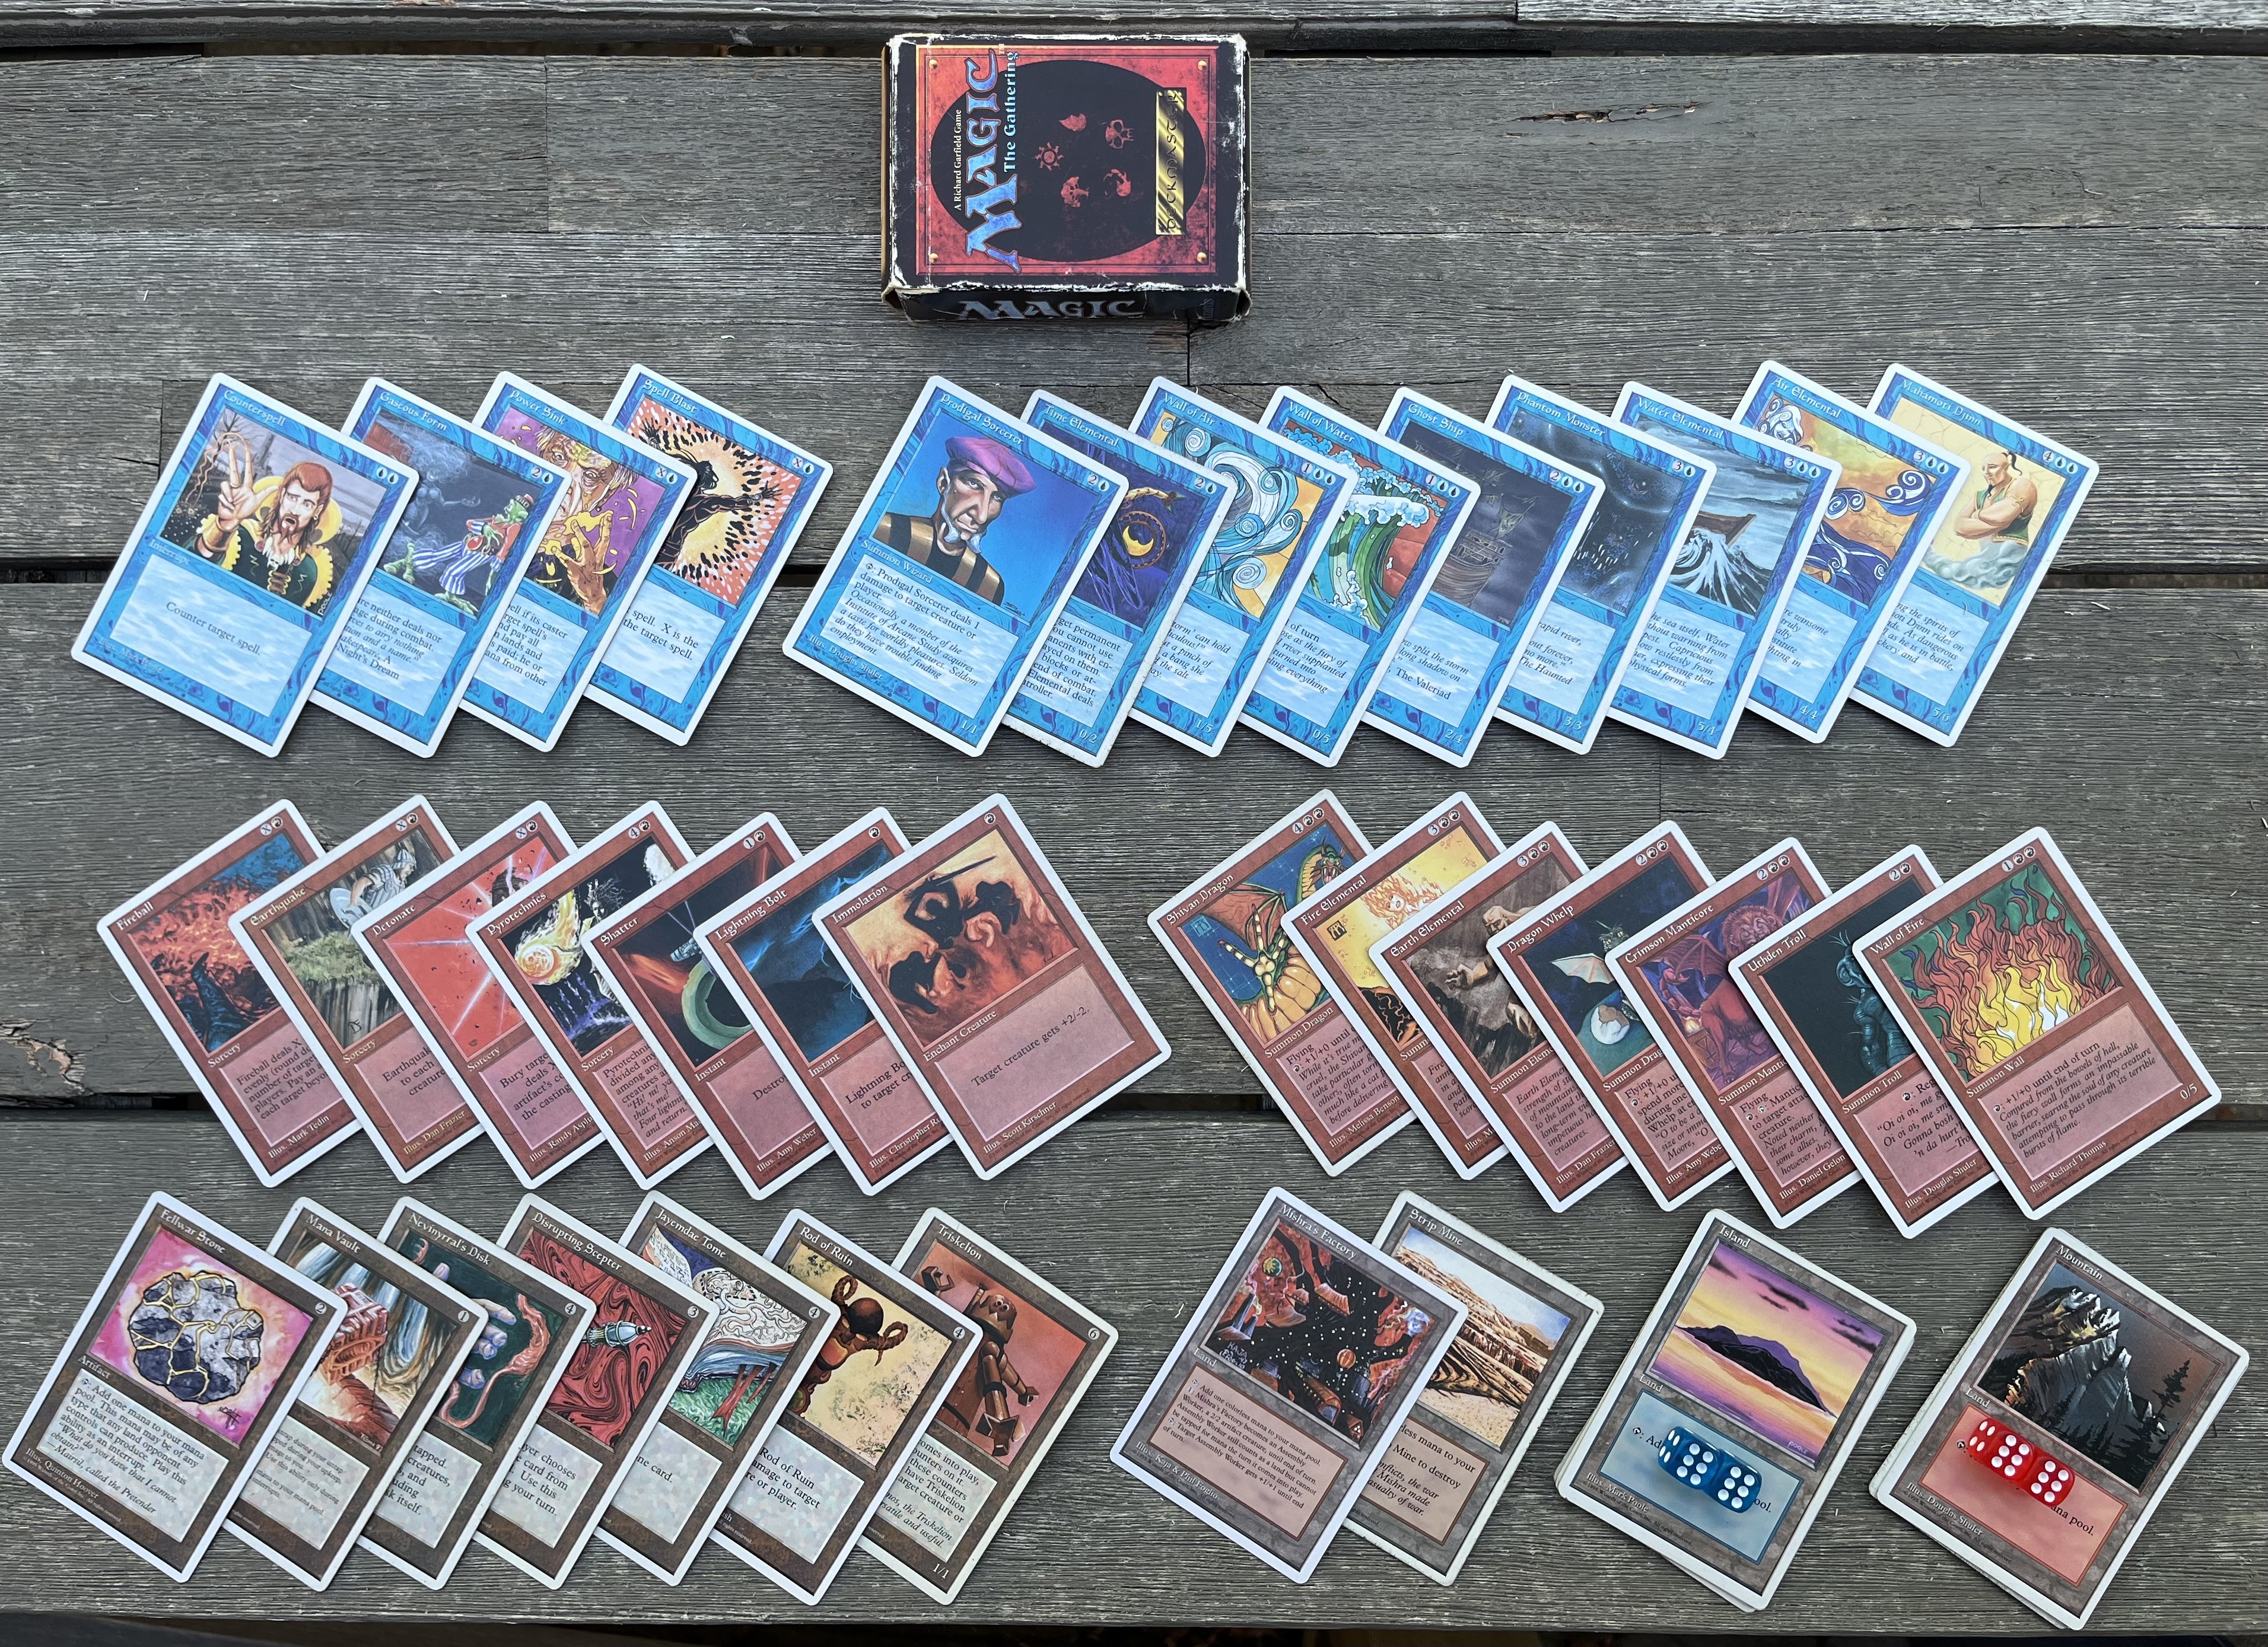
Golden Ghost Pepper Award — Season 10 September. Deck: elementals.dec
I really like white borders 🙂
To chime in with a bit of color that isn’t in the data – after my good performances, I found the world returning to real life after COVID. It became much harder to schedule and get in matches with everyone. In fact for season 9, I was on the cusp of tying for first place for the season if I had been able to even play 1 more match, let alone win it. With these changes in the world and my own life picking up, I decided I couldn’t commit the focus and dedication to NEOS like I had before. It’s not just scheduling matches that got harder. I also found it harder to find the time to design a deck from scratch for an unfamiliar format, test it, assemble & sleeve it, then unsleeve and put it back. So I found other goals and ways to enjoy the game. I started to try out some spice, winning two Golden Ghost Pepper Awards the following season. I wrote about playing Lich and elementals.dec for Season 12. In the seasons since, I have my moments, but I don’t expect I’ll ever get back to the consistency or performance of those early post-COVID seasons. I also think TwiddleVault was a dark horse at the time that gave me some free wins that have become more hard-fault battles these days. Still, I enjoy this game and community very much and have looked for and found other ways to enjoy this game than chasing after raw win rate.
Takeaways
Ten seasons is enough to say a few things with confidence — and a few things that are harder to see in the numbers but feel true after playing in this format for years.
- There is still a lot of variance in this game. Even Lucas Glavin, the best player in the dataset by a significant margin, loses roughly one in five matches. In a format where the card pool is fixed and the games are short, variance is baked in. The data doesn’t flatten that; it confirms it. You can be very good and still lose on any given night. Still, playing well over a long period of time is laudable and hard to maintain.
- Knowing that, there’s still a lot else I enjoy about it. That level playing field doesn’t take away from what I enjoy about this game. But it does land it squarely in the conclusion that it’s not realistic that skill alone propels people consistently into the Top 8, and that those that excel at this game take the long view and have their high highs with their tough beats too. Resilience is an important trait and so is consistency. The measure of success should not be always winning, but showing up and doing what you love. I think this community gets that right and I’m proud to be a part of this community. Thank you to everyone that is for making old school a special place.
- Adapting to changing formats is a key skill. NEOS doesn’t run the same format every month, and that variability is a real test. Lucas Glavin performs well across Atlantic, Swedish, Boreal, and everything in between — that cross-format adaptability is something I genuinely don’t have and can’t keep up with. It requires either a very broad deck knowledge or the ability to quickly recalibrate to a new ruleset, and it’s a distinct skill from simply knowing one deck in one format cold.
- I prefer the community and focus of doing in person events when I can. The scattered focus of scheduling and playing online with other people with busy lives has made the hobby have more friction to maintain. And I get more distracted trying to fit a thoughtful match into a tight time window. I don’t get to meet up with folks in person as much as I’d like, but when I do it’s a great time and I enjoy the experience tremendously.
- I’ve been shifting toward cube. Part of getting together in person with the Yetis in Colorado means we tend to cube more. It’s accessible and we’re able to draw more people in with this. It just works for our group. There’s also a view that limited formats are more skill-testing than constructed — in limited, you can’t just rely on knowing your deck, because you’re building it on the fly and making decisions under uncertainty the whole way through. I find that appealing too at this stage and it’s a nice evolution of stat-chasing in constructed.
My last month of Season 15, I was playing TwiddleVault and going into my last match at 4-1. A win meant I went to the knockout rounds and had a last bout of glory to wrap up my 10 seasons and this post with a resounding finale. I knew it would also boost my elo at the end a lot from my lows from playing spicy decks. But I didn’t win. I ended 4-2. And our pod had 5 people go 4-2. Of the 8 top point leaders the season, 4 of them were in our pod. Nobody went 5-1. I wasn’t particularly close on tie breakers. Instead, this ending tells the story that we’re all playing good decks against good opponents and it’s really tough to maintain a durable edge. That’s been my experience and part of what led me to see if I could validate that feeling with the data, which I feel I did. Victorious. And the people rejoice.

Methodology & What I Built
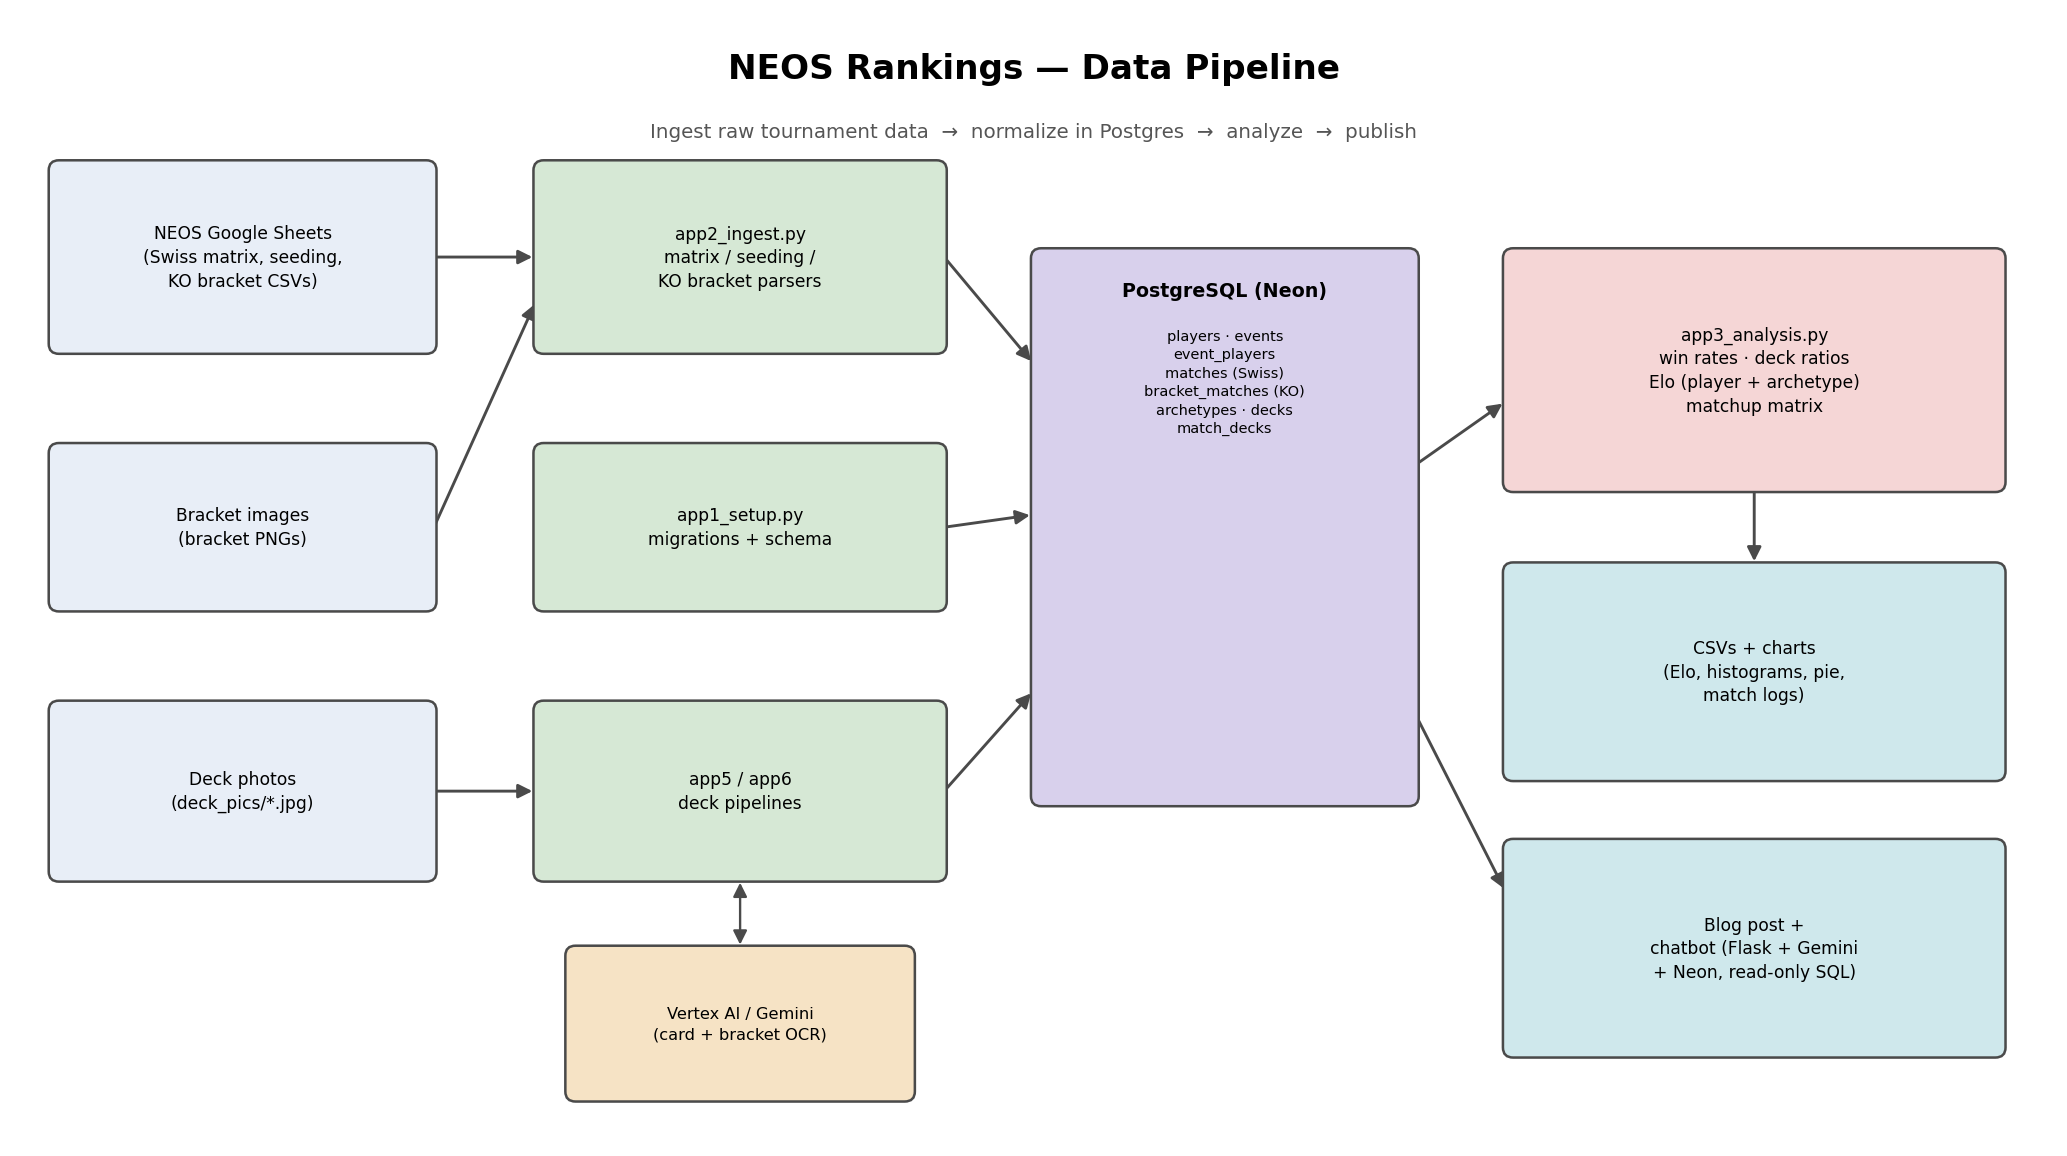
I built this project as a data pipeline and analysis engine for NEOS tournament results. I built most of this in 2 days back in February. I decided 10 seasons of NEOS was cooler than 9 seasons, so I waited. I then kept expanding it as I had more questions about the data I wanted to answer. At its core, it does three things:
- Ingests raw match data from the Google Sheets spreadsheets that the organizers already produce — no new data-entry burden on anyone.
- Stores everything in a PostgreSQL database, normalized and queryable.
- Analyzes it: per-player win rates, win-rate distributions, seeding correlation, and per-archetype performance.
The pipeline is built in Python, organized into focused apps. The first sets up the database. The second ingests data — parsing CSV matrix files, seeding tables, KO bracket CSVs, and deck photos via Google’s Vertex AI vision models. The third runs the analysis and spits out CSVs and charts.
The data starts life as a match matrix spreadsheet that Jared D. produces each season: a grid where each cell contains a player’s wins and losses against a specific opponent in that group. It’s a compact format that’s great for Google Sheets and unpleasant to parse programmatically. The ingestion pipeline detects group blocks, reads player headers, walks each cell, and normalizes everything into clean match records. From there, a seeding table from the knockout bracket CSV ties Swiss performance to seed numbers. The end result is a Postgres database that can answer questions the spreadsheet never could.
A separate bracket parser reads the visual-tree bracket data embedded in the KO CSVs (all NEOS seasons use a consistent format), and a per-card deck image scanner uses Vertex AI to identify individual cards from deck photos and classify each deck into one of ~30 Old School archetypes. With bracket results and deck archetypes in hand, the analysis layer computes archetype Elo ratings — power rankings based on head-to-head KO matchup outcomes.
I built and hosted a chatbot to answer questions on the dataset, but it didn’t work that great and it was hard to manage privacy and cost on it. Let me know if you’re interested and I can shoot you the link.
A caveat on the data and analysis: this was largely built by AI and I checked most everything, but there are some discrepancies in the raw spreadsheets that I tracked down from the actual players, and some of the calculations may be wrong. However, that’s always the case with human analysis too so I find reporting like this to be directional. What’s true for this particular dataset of 10 seasons may be different for other events or for one specific player playing a particular deck. As always, there is variance.
Data Access
The data behind this analysis — raw match data, bracket results, deck records, and the aggregate tables (archetype and player Elo ratings, win rates, format breakdowns) shown above — is not publicly distributed. It contains player names and match histories from the NEOS community.
If you’re interested in the data and looking into it yourself, let me know. Please reach out to me directly.
My analysis focused on Atlantic, Swedish, and Boreal because those are the formats I find most interesting and where most of my own play has been. The data and the pipeline cover all formats equally — Swedish, X Point, 7 Point, Original 6, and the rest. I just haven’t dug into them because they don’t line up with my interests. If anyone in the community wants to take a closer look at those slices, I’d love to see what you come up with.


Leave a Reply